Is inequality bad for the environment? | Inequality
That equality matters in terms of health and happiness has been clear for some years. But it is also better for the environment. The evidence (which is still emerging) suggests the most unequal affluent countries contribute more to climate change via pollution than their more equal counterparts.
They may suffer more, too. A new report predicts the United States will actually see its levels of economic inequality increase due to the uneven geographical effects of climate change â€" resulting in “the largest transfer of wealth from the poor to the rich in the country’s historyâ€, according the study’s lead author.
In a 2016 report, Oxfam found that the greatest polluters of all were the most affluent 10% of US households: each emitted, on average, 50 tonnes of CO2 per household member per year. Canada’s top 10% were the next most polluting, followed by the British, Russian and South African elites.
In more equitable affluent countries such as South Korea, Japan, France, Italy and Germany, the rich don’t just pollute less; the average pollution is lower too, because the bottom half of these populations pollute less than the bottom half in the US, Canada or Britain, despite being better off.
In short, people in more equal rich countries consume less, produce less waste and emit less carbon, on average. Indeed, almost everything associated with the environment improves when economic equality is greater.

Consumption and waste
When you buy an item, you don’t think about junking it. But you will eventually throw away almost everything you buy. Some of it you may recycle, but recycling is not only never fully efficient, it also uses a great deal of energy and hence generates pollution itself.
Not buying things you don’t need is far better, but in a world where the main function of advertising is to get you to buy things that you could live without, that is hard.
In more unequal societies, there is a proliferation of products that are designed not to last, so as to allow greater profits to be made. Producing endless must-have new versions exploits the higher levels of emotional insecurity that living with great inequality generates.
The success of the clothing industry is an interesting example. People buy far greater quantities of cheaper clothes and throw them away more frequently in the most economically unequal countries.
A recent UK survey of 2,000 women suggested that the majority of clothes are bought because they are seen as fashionable and are worn, on average, just seven times before they are discarded. A third of women see them as old after they have been worn three times.
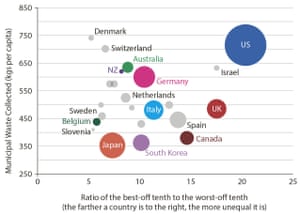
The chart above, in which each country is sized according to its population, tracks an environmental indicator (the vertical axis) against levels of inequality (the horizontal one). Countries to the right are more unequal, while countries that are high up produce more waste. If the correlation between the two were perfect, they would all line up along a line drawn from the bottom left to the top right. Inevitably there are outliers that don’t fit â€" in this case Denmark and Switzerland, and this could be because they do a better job of collecting data on waste than other countries.
But the tendency of the more unequal countries to produce more waste is still striking overall â€" and would be even more so if the 50 US states were included separately as smaller circles. In Japan people on average buy and throw away half as much as people in the US â€" of everything!
In economically unequal countries the pressure to buy items to keep up with your peers, with “people who countâ€, is enormous, especially when it comes to clothes, fashion, new cars and other status symbols. We are encouraged to be aspirational, to better ourselves, not for the greater good, but for selfish reasons â€" ultimately to be able to get all that stuff. A good job is no longer one which benefits society, but one that pays you well.
Eating meat
Eating a lot of meat is not good for you or the planet. The amount of crops that have to be grown and transported to feed the animals that we eat is far greater than the amount that would be needed if we just ate the crops themselves. So, the more meat per person that is eaten in a country, the less environmentally friendly the people of that country collectively are.
By weight (if we ignore insects and fish), most of the animal life on our planet is now intensively farmed for our own consumption. Those animals produce enormous amounts of greenhouse gases during their short lives, with cattle being the worst polluters of all. The most common bird on the planet is now the domestic chicken, reared solely because so many of us in the rich world have become so used to eating cheap meat.
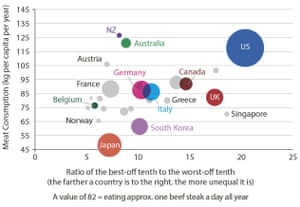
This chart suggests that the more unequal countries (again sized according to population) tend to consume more meat. Again, there are a few outliers â€" notably Australia and New Zealand/Aotearoa, possibly because their cultural histories are bound up with the rearing of sheep and cattle and their high levels of meat production. But the general trend is clear.
Increasing meat consumption has not made us healthier. In some countries, we are now eating so excessively that it is making many of us obese. Obesity rates are much higher in affluent countries that are more economically unequal. One theory as to why is that the poor in such countries have to resort to cheap fast food, which is advertised to them aggressively and often includes lower-grade meat. Another theory is that in more equitable countries, the population tends to be better educated and so can more easily see through the folly of fast-food advertising and gluttony.
What we do know is that people in more economically unequal countries in general eat more meat per person by weight. Whatever the reason, the world needs human beings to eat less meat if we are to avoid depleting our soils, increasing greenhouse gases and also reducing the biodiversity of the planet to such an extent that monocultures prevail and we lose habitats.
Water
We mainly extract water for agricultural uses, to water the crops that we then feed to the animals, but we also use water for industries that produce more stuff and more packaging for that stuff than we actually need.
The final use we have for water is for ourselves, for domestic use, and here, just as with meat, we can see huge variations between countries that are otherwise similarly wealthy. And again the variations appear to be related to economic inequality.
In more unequal affluent countries, people on average consume more water for personal use â€" or are far more wasteful over their use of water. This chart measures domestic water consumption against economic equality for the 25 most affluent countries in the world.
Again, the excessive use in the US stands out: consumption per person there is about three-and-a-half times higher than in Germany. It is not as if the US has ample rainfall: you can look at the US Drought Monitor any week of the year to see their ongoing problems.
The relationship between water consumption and inequality seems clear, though there is quite a lot of variation. The UK may use a little less water than might be predicted from its levels of economic inequality, partly because the climate of the UK makes it less useful to have private outdoor swimming pools if you are rich. In contrast, more water is used per head in Australia than might be expected from its level of inequality, presumably because of its warmer climate.
So why are people in Canada, Singapore and the US using so much more water for domestic purposes than those in Germany, France or Japan? Possibly there is a lot less concern about wasting water in more unequal countries. Toilet cisterns may be less “eco-friendlyâ€, people may worry a little less about watering the garden with a chlorinated supply designed for human consumption, not for plants.
It is not that people are cleaner and wash more often in the more inequitable countries (per person, the Japanese buy the most soap worldwide), and it is certainly not that they are drinking more water. What is happening is that they are wasting more, and that may be related to a more general ethos that people should be free to do as they wish and damn the consequences for others â€" an ethos that appears to be far more prevalent in more inequitable countries.
Carbon dioxide
The most damaging form of pollution (in terms of absolute effect) is the carbon dioxide (CO2) we are responsible for releasing into the atmosphere. Residents of the US contribute more emissions of CO2 than any other of the 25 rich countries featured. US emissions per person are almost twice those of the Japanese, and more than three times those of the French.
In general, the more economically unequal a rich country is, the more CO2 it emits. There are exceptions of course: the UK is a relatively low emitter because it currently has access to natural gas from the North Sea and has already mined and burned its most accessible coal; 75% of France’s electricity production derives from nuclear power, which emits less CO2 but creates much longer-lasting radioactive waste. In contrast, Australia mines and burns a great deal more coal (and also, incidentally, mines a large amount of uranium).
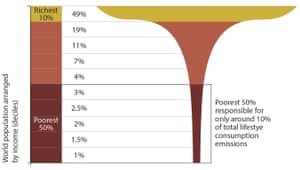
In 2016 Oxfam reported in detail on why emissions from some countries were so much greater than others (see chart above). Collaborating with economists including Thomas Piketty, it discovered that what drove excessive consumption in any particular affluent country was economic inequality, because the best-off in a country tend to waste more energy, heat their homes more than they need to, drive more than they need to in bigger gas-guzzling cars, take more flights and require more cement and other materials to construct their larger-than-needed buildings â€" while at the same time buying and throwing away more items.
Globally, half the CO2 emissions associated with individual lifestyles are due to the actions of the richest tenth of humanity, who disproportionately live in the more unequal of the world’s most affluent 25 countries.
Transport
Our excessive use of motor vehicles contributes not only CO2 but also other damaging gases such as carbon monoxide and nitrogen oxides, as well as pumping particulate matter into the air we all breathe.
Among the most affluent 25 countries, three stand out as extreme in this regard: the US, Canada and Australia. These three are among the least-densely populated countries in the rich world, and driving distances between homes and workplaces are often long, but they have chosen to arrange their cities in this way. That choice was again affected by economic inequality and the beliefs associated with it: that individual aspirations should trump the collective good, and that “the car is kingâ€.
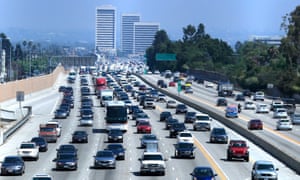
Relatively low petrol/gasoline use in the UK, Singapore and Israel shows that very unequal countries need not necessarily use huge amounts. In these three cases, there are large dense urban areas that can only function with good public transport such as underground trains, buses and trams.
But it is worth noting that no relatively equal affluent country consumes more than half as much gasoline as people in Canada and the US do each year. All of us will have to consume far less fossil fuel in the near future, and those reductions will be far more easily achieved in a country that sees the provision of efficient, low-polluting public transport as a collective good rather than a dangerous precedent.
Consider the proportion of people who cycle or walk to work in each country. This ranges from 50% (in the Netherlands) to less than 5% (in the US).
Everything is connected. People are fatter in the US because they eat more food; because they sit in cars more often and for longer; because they are exposed to more advertising and eat more and buy more cars as a result; because they live in greater fear of crime and so are afraid of not driving; and because they are surrounded by other obese people and therefore don’t feel so unusual if they are also fat.
But behind all of these factors lies the basic difference in how human beings are ranked. Rank them sky high by paying them many times more than other people, and they can become so conceited that they more easily treat others who are less well-off poorly, with no respect and with little empathy. When pay differentials are less and no-one’s income is out-of-this world, people realise they have far more in common with others. They then argue for cycle routes, pavements, good public transport, and to be able to afford to live near where they work.
Even in the US, there is still much hope â€" new learning occurring and new understanding growing â€" but it is happening locally rather than nationally. In Seattle, a 20mph limit was agreed in 2016 for all residential streets in the city. The downtown arterial roads in that city will now be limited to 25mph, making it far safer to cycle along those roads and to cross them as a pedestrian.
Such measures, of course, also encourage people not to believe their car will get them from place to place more quickly than others can travelling by bus or, where it is available, by light rail.
Air travel
One way in which the residents of affluent countries can pollute less is by flying less. Many of the flights we undertake are unnecessary, but we take them because we can. Of course, most people â€" even in affluent countries â€" will not fly in any given year, while a few will fly often.
Those who pollute the most (per person) are executives flown around in private jets. It is at take-off that aircraft use most fuel, so this chart shows the average number of airplane take-offs per person per year in each country. Again there is a relationship with inequality â€" and again, a few of the outliers can be explained by the presence of many remote settlements, or by a country being an island (in the case of New Zealand/Aotearoa).
The US dominates, and if circles for all its separate states were drawn, the overall pattern would look even more obvious. It could instead have chosen to develop a series of high-speed rail lines across its land, as other affluent countries have done and as even less affluent ones such as China are now doing.
The US is notable for the number of people living there that have never left their own country, so most of its air flights are internal. It is also well known for preferring free enterprise and competition to social planning. High-speed rail lines require planning and timetabling.
In the majority of the 25 countries, less than one plane takes off per year for every 100 people living there. In the UK it is nearer two planes, in the US three, in Canada four and in Norway five. Norway is famously equitable, but it is also remote and has access to relatively cheap aircraft fuel from its oilfields. Being more equitable is no guarantor of better environmental behaviour, but it tends to be associated with it.
So what now?
In 1443, Shinto priests who lived on the edge of Lake Suwa in Japan began recording the day when the lake froze over in winter and when the temperature changes created a ridge of ice across the surface. They believed the ridge was formed by the feet of the gods as they walked over the lake, and so they carried on recording the day the ridge was formed each year after that, to the present day.
In the first 250 years of the priests’ recordings, the lake only failed to freeze over three times. Between 1955 and 2004, it failed to freeze over 12 times. Between 2005 and 2014, it failed to freeze over five times â€" every other year. Since 2014 it has not frozen over.
There are many different records of global warming, but the Lake Suwa records are the longest and most striking.
It is only since the late 1970s that the 25 rich countries focused on in this article have begun to diverge widely in their levels of economic inequality. Because they have done so, a set of natural experiments has been set up which today allows research into the effects of these differences.
The preliminary conclusion, based on these natural experiments, is that the more economically equitable countries tend to perform better across a wide range of environmental measures. Once we know what the driving forces are, and become fully aware of the damage that is done by inequality in environmental as well as social terms, we will know how necessary it is to embrace change.
This is an edited extract from The Equality Effect, by Danny Dorling (RRP £9.99). It is available from the Guardian Bookshop for £8.49. You can also explore all the data in the book here.
Follow the Guardian’s Inequality Project on Twitter here, or you can email us at inequality.project@theguardian.com

0 Response to "Is inequality bad for the environment? | Inequality"
Posting Komentar